Data Visualization Demo
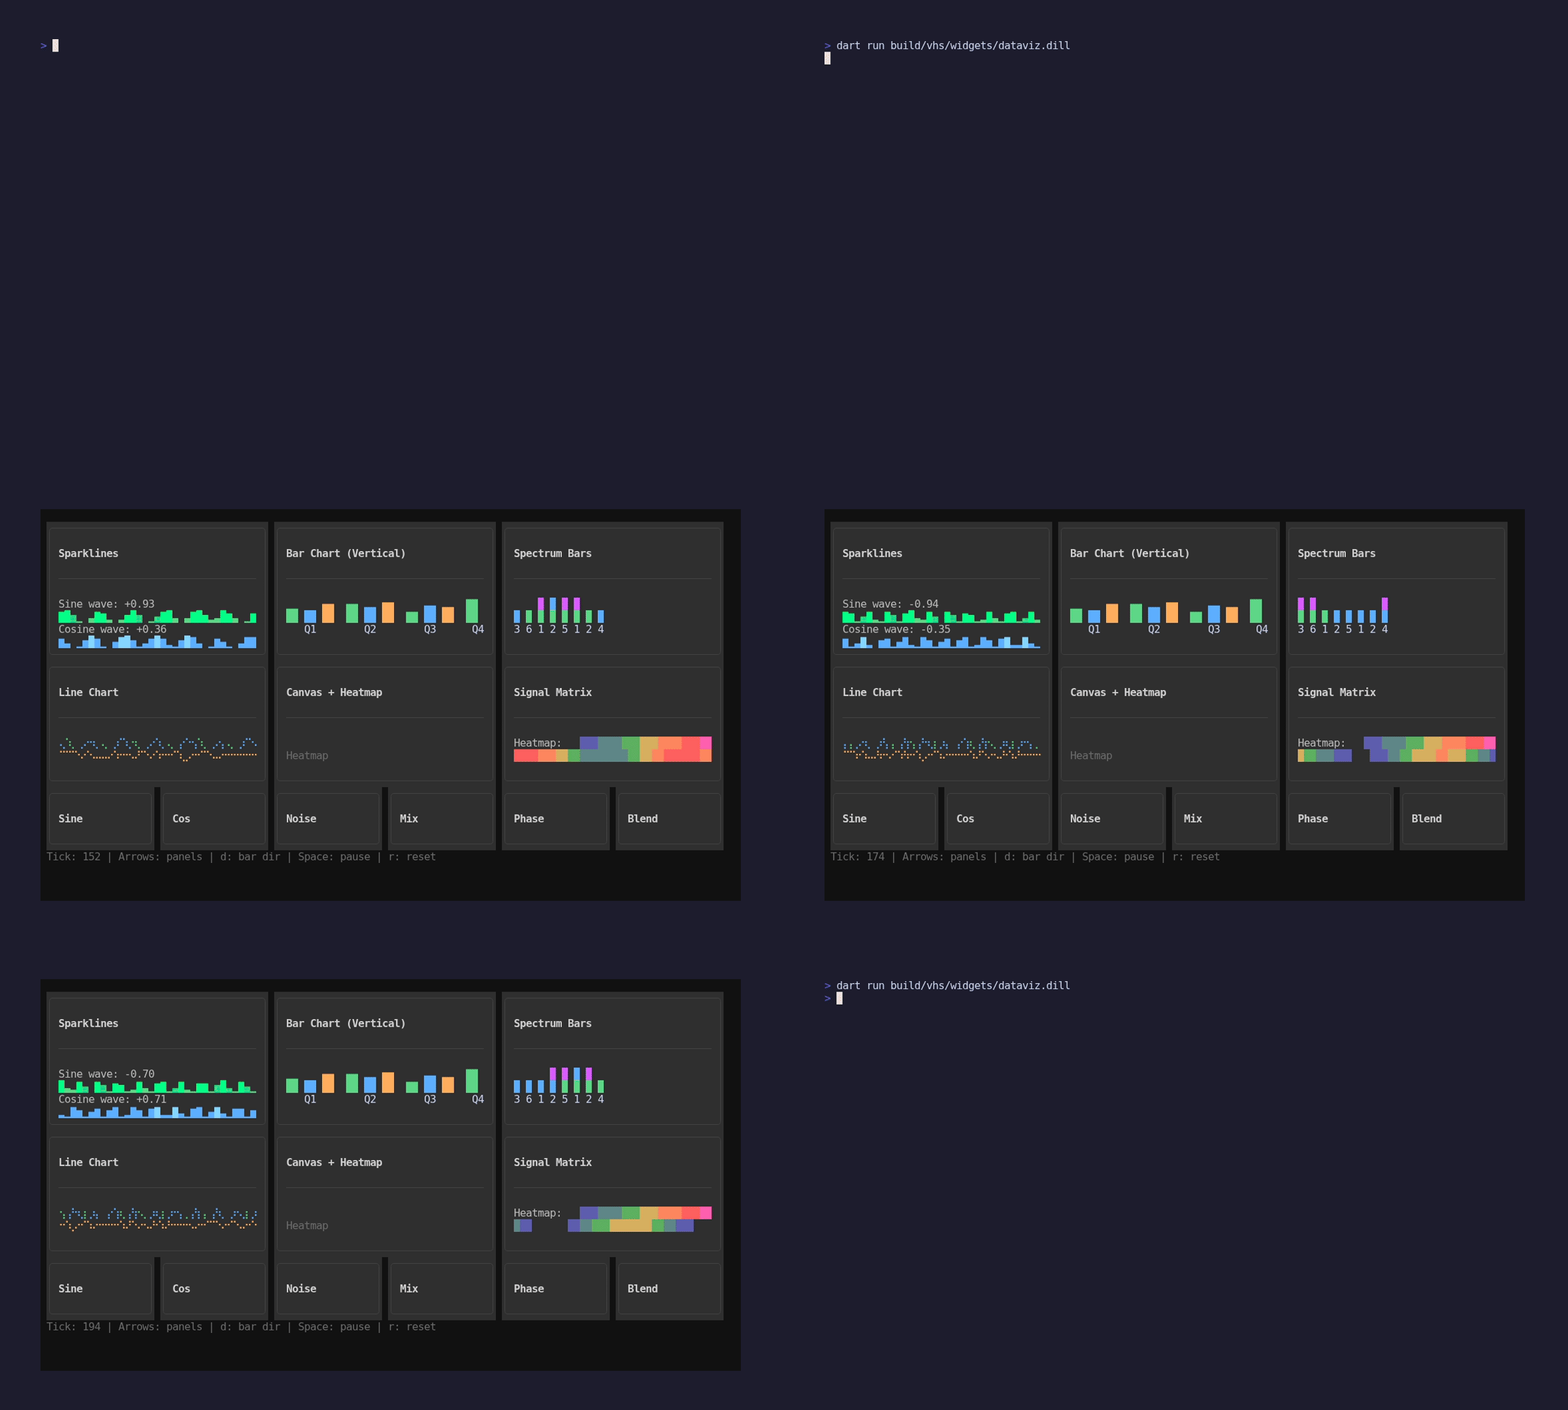
Matches the Frankentui ftui-demo-showcase DataViz screen layout: Top: Sparklines | Bar Chart (Grouped) | Spectrum Bars (Stacked) Middle: Line Chart (Multi-se...
- Preview
- Code
pkgs/artisanal_widgets/example/dataviz/main.dart
// Data Visualization Demo
import 'package:artisanal_widgets/artisanal_widgets.dart';
//
// Matches the Frankentui ftui-demo-showcase DataViz screen layout:
// Top: Sparklines | Bar Chart (Grouped) | Spectrum Bars (Stacked)
// Middle: Line Chart (Multi-series Braille) | Signal Matrix (Heatmap + Legend)
// Bottom: Micro Panels (Sine, Cos, Noise, Mix, Phase, Blend)
//
// Controls: d=toggle bar direction, Space=pause, r=reset, q=quit
//
// Run with: dart run example/dataviz/main.dart
import 'dart:math' as math;
import 'package:artisanal/style.dart' hide Padding, Align;
import 'package:artisanal/artisanal.dart' show BrailleCanvas;
import 'package:artisanal/tui.dart' as tui;
import 'package:artisanal/uv.dart' show UvStyle, UvColor, Cell;
import 'package:artisanal_widgets/widgets.dart' as w;
import 'package:artisanal_widgets/charting.dart' as charting;
void main() async {
final app = WidgetApp(DataVizDemo());
await tui.runProgram(
app,
options: const tui.ProgramOptions(
altScreen: true,
mouse: true,
mouseMode: tui.MouseMode.allMotion,
),
);
}
class DataVizDemo extends w.StatefulWidget {
DataVizDemo({super.key});
w.State createState() => _DataVizDemoState();
}
class _DataVizDemoState extends w.State<DataVizDemo> {
static const _initialTick = 144;
static const _u64Mask = 0xFFFFFFFFFFFFFFFF;
int _tick = _initialTick;
bool _paused = false;
bool _barHorizontal = false;
static const _maxPoints = 60;
final _sine = <double>[];
final _cosine = <double>[];
final _noise = <double>[];
void initState() {
super.initState();
for (var t = _initialTick - 30; t < _initialTick; t++) {
_addPoint(t);
}
}
void _addPoint(int t) {
_sine.add(math.sin(t.toDouble()));
_cosine.add(math.cos(t.toDouble()));
_noise.add(_detRange((t * 53) & _u64Mask, -1.0, 1.0));
if (_sine.length > _maxPoints) {
_sine.removeAt(0);
_cosine.removeAt(0);
_noise.removeAt(0);
}
}
int _detHash(int seed) {
var z = (seed + 0x9e3779b97f4a7c15) & _u64Mask;
z = (((z ^ (z >> 30)) & _u64Mask) * 0xbf58476d1ce4e5b9) & _u64Mask;
z = (((z ^ (z >> 27)) & _u64Mask) * 0x94d049bb133111eb) & _u64Mask;
return (z ^ (z >> 31)) & _u64Mask;
}
double _detFloat(int seed) {
final hash = _detHash(seed);
return (hash >> 11) / (1 << 53);
}
double _detRange(int seed, double lo, double hi) {
return lo + _detFloat(seed) * (hi - lo);
}
void _reset() {
_sine.clear();
_cosine.clear();
_noise.clear();
_tick = _initialTick;
for (var t = _initialTick - 30; t < _initialTick; t++) {
_addPoint(t);
}
}
double _norm(double v) => ((v + 1) * 0.5).clamp(0.0, 1.0);
charting.ChartRamp get _heatmapRamp => charting.ChartRamp(const [
UvColor.rgb(30, 30, 80),
UvColor.rgb(50, 50, 180),
UvColor.rgb(50, 150, 150),
UvColor.rgb(80, 180, 80),
UvColor.rgb(220, 180, 50),
UvColor.rgb(255, 140, 50),
UvColor.rgb(255, 80, 80),
UvColor.rgb(255, 100, 180),
]);
w.Widget build(w.BuildContext context) {
final theme = widget.theme;
final label = theme.labelSmall.copy()..foreground(theme.onBackground);
final dim = theme.bodySmall.copy()..foreground(theme.muted);
final c1 = UvColor.rgb(80, 200, 120);
final c2 = UvColor.rgb(80, 160, 255);
final c3 = UvColor.rgb(255, 180, 60);
final c4 = UvColor.rgb(200, 100, 255);
final c5 = UvColor.rgb(0, 200, 200);
final c6 = UvColor.rgb(255, 100, 100);
final ls = _sine.isNotEmpty ? _sine.last : 0.0;
final lc = _cosine.isNotEmpty ? _cosine.last : 0.0;
final ln = _noise.isNotEmpty ? _noise.last : 0.0;
final pauseLabel = _paused ? ' [PAUSED]' : '';
// Derived series for micro panels
final mixData = List.generate(
_sine.length,
(i) => (_sine[i] + _cosine[i]) * 0.5,
);
final phaseData = List.generate(_sine.length, (i) => _sine[i] * _cosine[i]);
final blendData = List.generate(
_sine.length,
(i) => (_sine[i] + _noise[i]) * 0.5,
);
return w.Container(
padding: const w.EdgeInsets.all(1),
color: theme.background,
child: w.Column(
gap: 0,
crossAxisAlignment: w.CrossAxisAlignment.stretch,
children: [
// ── Top row: Sparklines | Bar Chart | Spectrum ──
w.Expanded(
flex: 42,
child: w.Row(
gap: 1,
children: [
// Sparklines panel (7 rows: label, spark, label, spark, label, spark, minis)
w.Expanded(
child: w.PanelBox(
title: 'Sparklines',
child: w.Column(
gap: 0,
children: [
w.Text(
'Sine wave: ${ls >= 0 ? "+" : ""}${ls.toStringAsFixed(2)}',
style: label,
),
charting.SparklineChart(
values: _sine,
height: 1,
baseline: -2.0,
minValue: -1.0,
maxValue: 1.0,
gradientLow: UvStyle(fg: c1),
gradientHigh: UvStyle(fg: UvColor.rgb(0, 255, 120)),
),
w.Text(
'Cosine wave: ${lc >= 0 ? "+" : ""}${lc.toStringAsFixed(2)}',
style: label,
),
charting.SparklineChart(
values: _cosine,
height: 1,
baseline: -2.0,
minValue: -1.0,
maxValue: 1.0,
gradientLow: UvStyle(fg: c2),
gradientHigh: UvStyle(fg: UvColor.rgb(120, 200, 255)),
),
w.Text(
'Random noise: ${ln >= 0 ? "+" : ""}${ln.toStringAsFixed(2)}',
style: label,
),
charting.SparklineChart(
values: _noise,
height: 1,
baseline: -2.0,
minValue: -1.0,
maxValue: 1.0,
gradientLow: UvStyle(fg: c3),
gradientHigh: UvStyle(fg: UvColor.rgb(255, 220, 100)),
),
w.Row(
gap: 1,
children: [
w.Expanded(child: _microBar('SIN', _norm(ls), c1)),
w.Expanded(child: _microBar('COS', _norm(lc), c2)),
w.Expanded(child: _microBar('RND', _norm(ln), c3)),
],
),
],
),
),
),
// Grouped bar chart
w.Expanded(
child: w.PanelBox(
title:
'Bar Chart (${_barHorizontal ? "Horizontal" : "Vertical"})',
child: w.Expanded(
child: charting.BarChart(
series: [
[42, 58, 35, 70],
[38, 45, 52, 60],
[55, 62, 48, 75],
],
barStyles: [
UvStyle(fg: c1),
UvStyle(fg: c2),
UvStyle(fg: c3),
],
xLabels: _barHorizontal
? null
: ['Q1', 'Q2', 'Q3', 'Q4'],
yLabels: _barHorizontal
? ['Q1', 'Q2', 'Q3', 'Q4']
: null,
legendEntries: [
charting.ChartLegendEntry(
label: 'Series A',
style: UvStyle(fg: c1),
),
charting.ChartLegendEntry(
label: 'Series B',
style: UvStyle(fg: c2),
),
charting.ChartLegendEntry(
label: 'Series C',
style: UvStyle(fg: c3),
),
],
direction: _barHorizontal
? charting.BarChartDirection.horizontal
: charting.BarChartDirection.vertical,
mode: charting.BarChartMode.grouped,
showAxis: true,
drawAxisLine: false,
barWidth: 2,
barGap: 1,
groupGap: 2,
),
),
),
),
// Spectrum bars (stacked)
w.Expanded(
child: w.PanelBox(
title: 'Spectrum Bars',
child: w.Expanded(
child: charting.BarChart(
series: _spectrumSeries(),
barStyles: [
UvStyle(fg: c1),
UvStyle(fg: c2),
UvStyle(fg: c4),
],
xLabels: [
'32Hz',
'64Hz',
'125Hz',
'250Hz',
'500Hz',
'1k',
'2k',
'4k',
],
direction: charting.BarChartDirection.vertical,
mode: charting.BarChartMode.stacked,
showAxis: true,
drawAxisLine: false,
barWidth: 1,
barGap: 0,
groupGap: 1,
),
),
),
),
],
),
),
// ── Middle row: Line Chart | Canvas + Heatmap | Signal Matrix ──
w.Expanded(
flex: 38,
child: w.Row(
gap: 1,
children: [
// Multi-series line chart
w.Expanded(
child: w.PanelBox(
title: 'Line Chart',
child: w.Expanded(
child: charting.LineChart(
series: [_sine, _cosine, _noise],
lineStyles: [
UvStyle(fg: c1),
UvStyle(fg: c2),
UvStyle(fg: c3),
],
legendEntries: [
charting.ChartLegendEntry(
label: 'sin(t)',
style: UvStyle(fg: c1),
),
charting.ChartLegendEntry(
label: 'cos(t)',
style: UvStyle(fg: c2),
),
charting.ChartLegendEntry(
label: 'noise',
style: UvStyle(fg: c3),
),
],
showGrid: false,
showMarkers: false,
minValue: -1.1,
maxValue: 1.1,
),
),
),
),
// Canvas + Heatmap (Lissajous curve on top, heatmap below)
w.Expanded(
child: w.PanelBox(
title: 'Canvas + Heatmap',
child: w.Expanded(
child: w.Column(
gap: 0,
children: [
// Lissajous curve rendered in braille sub-cells.
w.Expanded(
flex: 62,
child: charting.CustomChart(
painter: _paintLissajous,
),
),
// Small heatmap below
w.Expanded(
flex: 38,
child: w.Column(
gap: 0,
children: [
w.Text(
'Heatmap',
style: widget.theme.bodySmall.copy()
..foreground(widget.theme.muted),
),
w.Expanded(
child: charting.CustomChart(
painter: _paintSmallHeatmap,
),
),
],
),
),
],
),
),
),
),
// Signal Matrix (full heatmap + gradient legend)
w.Expanded(
child: w.PanelBox(
title: 'Signal Matrix',
child: w.Expanded(
child: w.Column(
gap: 0,
children: [
_gradientLegend(_heatmapRamp),
w.Expanded(
child: charting.CustomChart(
painter: _paintSignalMatrix,
),
),
],
),
),
),
),
],
),
),
// ── Bottom row: Micro panels ──
w.Expanded(
flex: 20,
child: w.Row(
gap: 1,
children: [
_microPanel('Sine', _sine, c1),
_microPanel('Cos', _cosine, c2),
_microPanel('Noise', _noise, c3),
_microPanel('Mix', mixData, c4),
_microPanel('Phase', phaseData, c5),
_microPanel('Blend', blendData, c6),
],
),
),
// Status bar
w.Text(
'Tick: $_tick$pauseLabel | Arrows: panels | d: bar dir | Space: pause | r: reset',
style: dim,
),
],
),
);
}
List<List<double>> _spectrumSeries() {
final phase = _tick * 0.12;
final a = <double>[], b = <double>[], c = <double>[];
for (var i = 0; i < 8; i++) {
final t = phase + i * 0.55;
a.add((math.sin(t) * 0.5 + 0.5) * 70.0 + 10.0);
b.add((math.cos(t) * 0.5 + 0.5) * 55.0 + 12.0);
c.add((math.sin(t * 1.3) * 0.5 + 0.5) * 40.0 + 8.0);
}
return [a, b, c];
}
double _heatmapValue(double nx, double ny) {
final phase = _tick * 0.05;
final waveX = math.sin(nx * math.pi * 2 * 1.2 + phase) * 0.5 + 0.5;
final waveY = math.cos(ny * math.pi * 2 * 0.9 - phase) * 0.5 + 0.5;
return (0.6 * waveX + 0.4 * waveY).clamp(0.0, 1.0);
}
void _paintHeatmap(dynamic screen, dynamic area) {
final width = area.width as int;
final height = area.height as int;
if (width <= 0 || height <= 0) return;
final w = width.toDouble().clamp(1, double.infinity);
final h = height.toDouble().clamp(1, double.infinity);
for (var dy = 0; dy < height; dy++) {
final ny = dy / ((h - 1).clamp(1, double.infinity));
for (var dx = 0; dx < width; dx++) {
final nx = dx / ((w - 1).clamp(1, double.infinity));
final value = _heatmapValue(nx, ny);
screen.setCell(
area.minX + dx,
area.minY + dy,
Cell(
content: ' ',
style: UvStyle(bg: _heatmapRamp.colorFor(value)),
),
);
}
}
}
void _paintSmallHeatmap(dynamic screen, dynamic area) =>
_paintHeatmap(screen, area);
void _paintSignalMatrix(dynamic screen, dynamic area) =>
_paintHeatmap(screen, area);
UvColor _accentGradient(double t) {
final stops = <UvColor>[
UvColor.rgb(80, 200, 255),
UvColor.rgb(180, 80, 255),
UvColor.rgb(255, 100, 180),
UvColor.rgb(180, 255, 120),
UvColor.rgb(255, 220, 100),
];
return stops[(t.clamp(0.0, 0.9999) * stops.length).floor()];
}
void _paintLissajous(dynamic screen, dynamic area) {
if (area.width < 2 || area.height < 2) return;
final painter = BrailleCanvas(area.width, area.height);
final pw = painter.dotWidth.toDouble();
final ph = painter.dotHeight.toDouble();
final phase = _tick * 0.05;
final cx = pw / 2.0;
final cy = ph / 2.0;
final rx = (pw / 2.0) - 2.0;
final ry = (ph / 2.0) - 2.0;
const steps = 500;
for (var i = 0; i < steps; i++) {
final t = (i / steps) * math.pi * 2;
final x = cx + rx * math.sin(3.0 * t + phase);
final y = cy + ry * math.sin(2.0 * t);
final colorT = ((i / steps) + phase * 0.02) % 1.0;
painter.point(
x.round(),
y.round(),
style: UvStyle(fg: _accentGradient(colorT)),
);
}
painter.rect(
0,
0,
painter.dotWidth - 1,
painter.dotHeight - 1,
style: const UvStyle(fg: UvColor.rgb(120, 220, 255)),
);
painter.renderTo(screen, area);
}
/// Gradient legend bar using the same ramp as the heatmap.
w.Widget _gradientLegend(charting.ChartRamp ramp) {
final lblStyle = widget.theme.labelSmall.copy()
..foreground(widget.theme.onBackground);
return w.Row(
gap: 1,
children: [
w.Text('Heatmap:', style: lblStyle),
w.Expanded(
child: charting.CustomChart(
height: 1,
painter: (screen, area) {
final width = area.width;
for (var dx = 0; dx < width; dx++) {
final t = width <= 1 ? 0.0 : dx / (width - 1);
screen.setCell(
area.minX + dx,
area.minY,
Cell(
content: ' ',
style: UvStyle(bg: ramp.colorFor(t)),
),
);
}
},
),
),
],
);
}
w.Widget _microBar(String lbl, double value, UvColor color) {
// Label + percentage text (matching Rust render_mini_bar)
final pct = (value * 100).toStringAsFixed(0);
return w.Row(
gap: 0,
children: [
w.Text(
'$lbl ',
style: widget.theme.bodySmall.copy()..foreground(widget.theme.muted),
),
w.Text(
'$pct%',
style: widget.theme.bodySmall.copy()..foreground(widget.theme.muted),
),
],
);
}
w.Widget _microPanel(String title, List<double> data, UvColor color) {
final theme = widget.theme;
final dimStyle = theme.bodySmall.copy()..foreground(theme.muted);
final last = data.isNotEmpty ? data.last : 0.0;
final value = _norm(last);
final pct = (value * 100).toStringAsFixed(0);
final progressColor = switch (title) {
'Sine' => Colors.cyan,
'Cos' => Colors.green,
'Noise' => Colors.yellow,
'Mix' => Colors.magenta,
'Phase' => Colors.cyan,
'Blend' => Colors.red,
_ => Colors.blue,
};
return w.Expanded(
child: w.PanelBox(
title: title,
child: w.Column(
gap: 0,
children: [
charting.SparklineChart(
values: data,
height: 1,
baseline: -2.0,
minValue: -1.0,
maxValue: 1.0,
style: UvStyle(fg: color),
),
w.LinearProgressIndicator(
value: value,
width: 18,
color: progressColor,
backgroundColor: Colors.gray600,
),
w.Text('$pct%', style: dimStyle),
],
),
),
);
}
tui.Cmd? handleUpdate(tui.Msg msg) {
if (msg is tui.KeyMsg) {
final ch = msg.key.char;
if (ch == 'q') return tui.Cmd.quit();
if (ch == 'd') {
setState(() => _barHorizontal = !_barHorizontal);
return null;
}
if (ch == ' ') {
setState(() => _paused = !_paused);
return null;
}
if (ch == 'r') {
setState(_reset);
return null;
}
}
if (msg is tui.TickMsg) {
if (!_paused) {
setState(() {
_tick++;
_addPoint(_tick);
});
}
}
return null;
}
tui.Cmd? handleInit() =>
tui.every(const Duration(milliseconds: 100), (t) => tui.TickMsg(t));
}
Run it
dart run pkgs/artisanal_widgets/example/dataviz/main.dart