Charting Widgets Showcase
Demonstrates all chart types: Sparkline, Line, Bar, Heatmap, Pie, and Ribbon. Uses tabs to switch between charts. The Line chart tab also shows ChartBuilder ...
- Preview
- Code
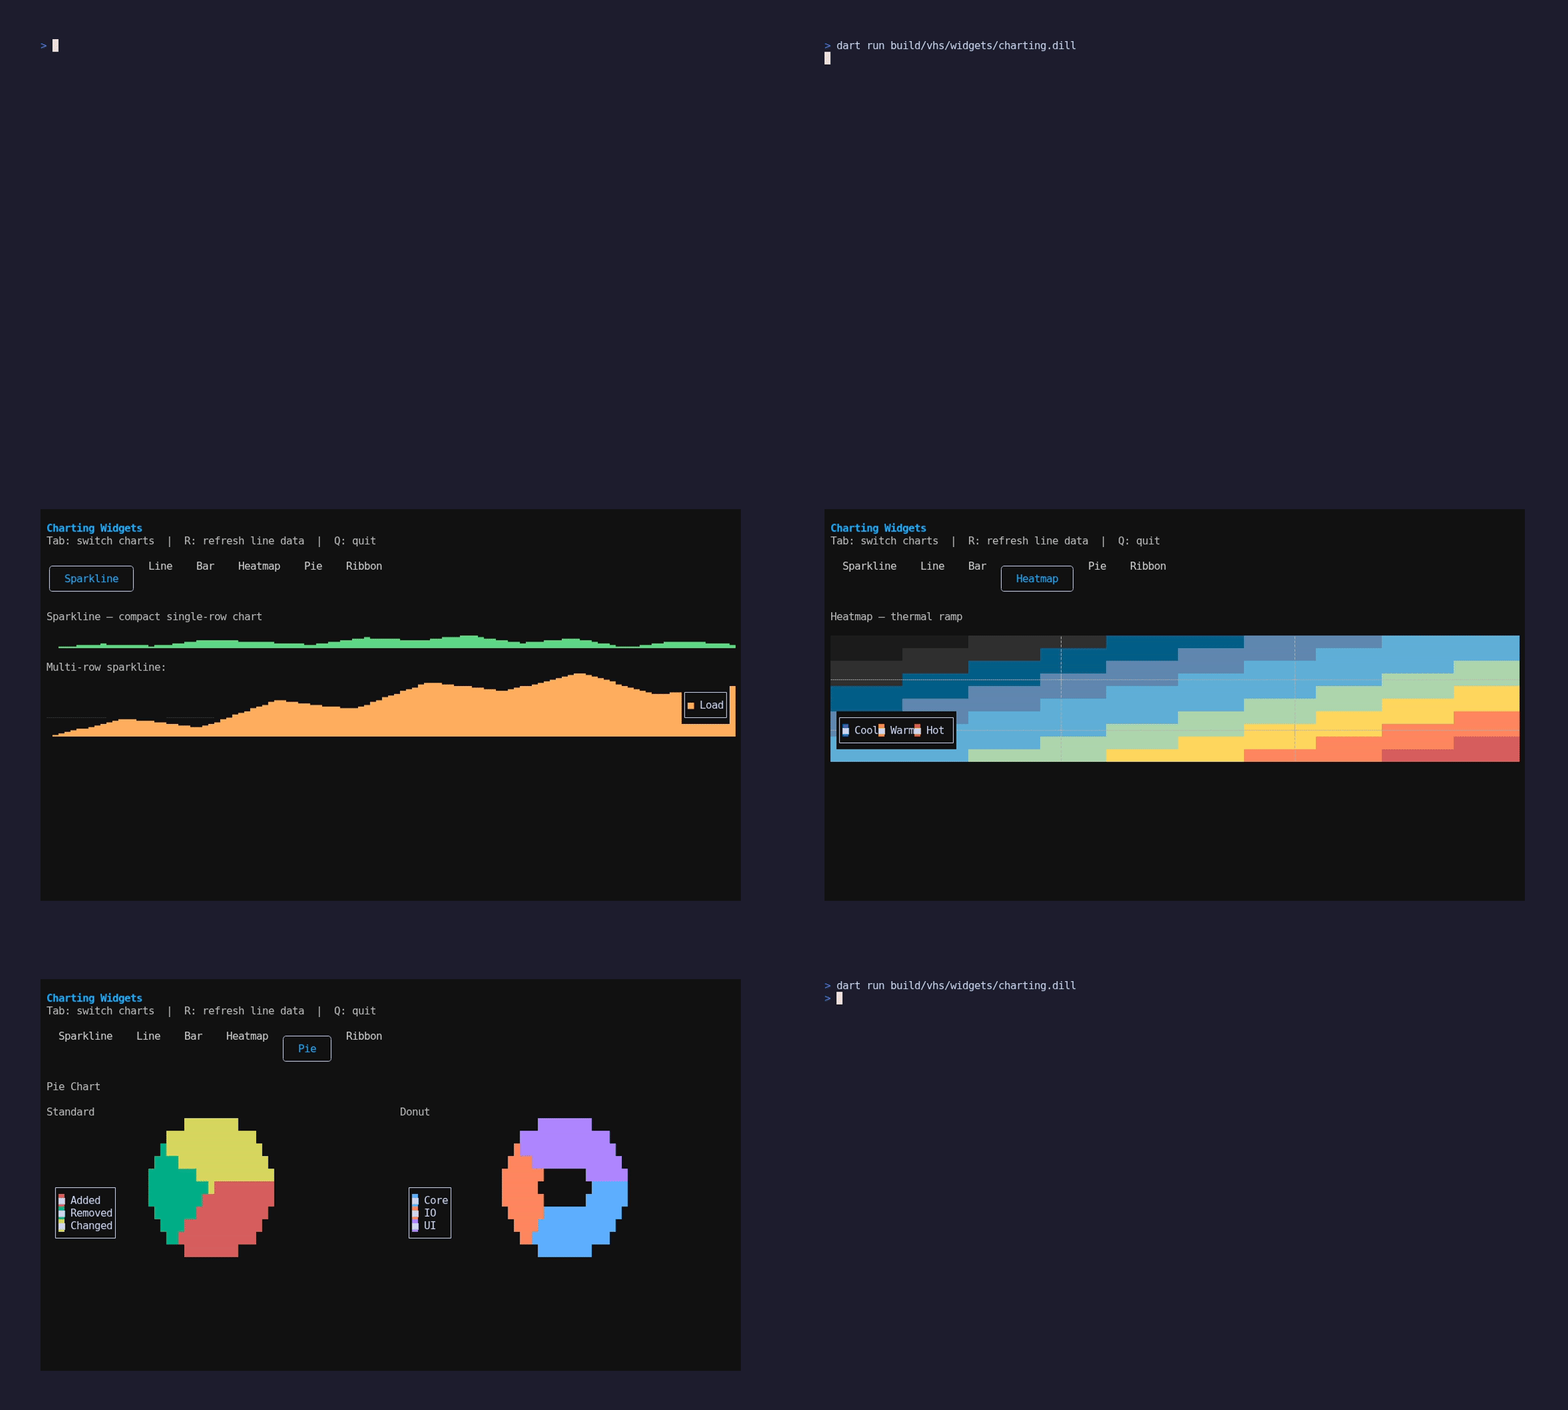
pkgs/artisanal_widgets/example/charting/main.dart
// Charting Widgets Showcase
import 'package:artisanal_widgets/artisanal_widgets.dart';
//
// Demonstrates all chart types: Sparkline, Line, Bar, Heatmap, Pie, and
// Ribbon. Uses tabs to switch between charts. The Line chart tab also
// shows ChartBuilder with a ChartModel that updates on key press.
//
// Charts are responsive — they fill available terminal space. Mouse hover
// shows a crosshair overlay on each chart.
//
// Run with: dart run example/charting/main.dart
import 'dart:math' as math;
import 'package:artisanal/artisanal.dart' show ChartLegendEntry, ChartRamp;
import 'package:artisanal/style.dart' hide Padding, Align;
import 'package:artisanal/tui.dart' as tui;
import 'package:artisanal/uv.dart' show UvStyle, UvColor;
import 'package:artisanal_widgets/charting.dart' as w;
void main() async {
final app = WidgetApp(ChartShowcase());
await tui.runProgram(
app,
options: const tui.ProgramOptions(
altScreen: true,
mouse: true,
mouseMode: tui.MouseMode.allMotion,
),
);
}
// ---------------------------------------------------------------------------
// HoverTracker — captures mouse motion events and provides local coordinates
// ---------------------------------------------------------------------------
/// A stateful wrapper that tracks the mouse position within its bounds and
/// passes local coordinates to a builder callback.
class _HoverTracker extends w.StatefulWidget {
_HoverTracker({required this.builder});
final w.Widget Function(w.BuildContext context, int? localX, int? localY)
builder;
w.State createState() => _HoverTrackerState();
}
class _HoverTrackerState extends w.State<_HoverTracker> {
int? _localX;
int? _localY;
bool _hitTestedThisFrame = false;
w.Widget build(w.BuildContext context) {
return widget.builder(context, _localX, _localY);
}
tui.Cmd? handleUpdate(tui.Msg msg) {
// Hit-test dispatch: the child's render object was hit, so we receive
// local coordinates via dispatchBubbleUp.
if (msg is tui.HitTestMouseMsg) {
_hitTestedThisFrame = true;
final action = msg.event.action;
if (action == tui.MouseAction.motion || action == tui.MouseAction.press) {
final nx = msg.localX.toInt();
final ny = msg.localY.toInt();
if (nx != _localX || ny != _localY) {
setState(() {
_localX = nx;
_localY = ny;
});
}
}
return null;
}
// Broadcast MouseMsg follows every hit-test dispatch. If we were
// hit-tested this frame the cursor is still inside — just reset the
// flag. Otherwise the cursor has left our bounds → clear crosshair.
if (msg is tui.MouseMsg) {
if (msg.action == tui.MouseAction.motion) {
if (_hitTestedThisFrame) {
_hitTestedThisFrame = false;
} else if (_localX != null || _localY != null) {
setState(() {
_localX = null;
_localY = null;
});
}
} else {
_hitTestedThisFrame = false;
}
}
return null;
}
}
// ---------------------------------------------------------------------------
// ChartShowcase — main showcase widget
// ---------------------------------------------------------------------------
class ChartShowcase extends w.StatefulWidget {
ChartShowcase({super.key});
w.State createState() => _ChartShowcaseState();
}
class _ChartShowcaseState extends w.State<ChartShowcase> {
final w.WidgetScrollController _scrollController = w.WidgetScrollController();
int _tabIndex = 0;
final _rng = math.Random(42);
// Model-driven line chart data (updated via key press)
late final w.ChartModel _lineModel;
int _dataRevision = 0;
void initState() {
super.initState();
_lineModel = w.ChartModel(
type: w.ChartType.line,
values: _generateLineData(),
showGrid: true,
showMarkers: true,
);
}
List<double> _generateLineData() {
return List.generate(20, (i) => 5 + _rng.nextDouble() * 40);
}
void _refreshLineData() {
setState(() {
_dataRevision++;
_lineModel.values = _generateLineData();
});
}
void dispose() {
_lineModel.dispose();
super.dispose();
}
w.Widget build(w.BuildContext context) {
final theme = widget.theme;
final titleStyle = theme.titleLarge.copy()..foreground(theme.primary);
final labelStyle = theme.labelSmall.copy()..foreground(theme.onBackground);
final tabNames = ['Sparkline', 'Line', 'Bar', 'Heatmap', 'Pie', 'Ribbon'];
return w.Container(
padding: const w.EdgeInsets.all(1),
color: theme.background,
child: w.Scrollbar(
controller: _scrollController,
thickness: 1,
gap: 1,
enableHover: true,
trackChar: ' ',
child: w.SingleChildScrollView(
controller: _scrollController,
child: w.Column(
crossAxisAlignment: w.CrossAxisAlignment.start,
children: [
w.Text('Charting Widgets', style: titleStyle),
w.Text(
'Tab: switch charts | R: refresh line data | Q: quit',
style: labelStyle,
),
w.SizedBox(height: 1),
// Tab bar
w.Row(
children: List.generate(tabNames.length, (i) {
final selected = i == _tabIndex;
final tabStyle =
(selected ? theme.labelLarge : theme.labelSmall).copy()
..foreground(
selected ? theme.primary : theme.onSurface,
);
return w.GestureDetector(
onTap: () {
setState(() => _tabIndex = i);
return null;
},
child: w.Container(
padding: const w.EdgeInsets.symmetric(
horizontal: 2,
vertical: 0,
),
decoration: selected
? w.BoxDecoration(border: Border.rounded)
: null,
child: w.Text(tabNames[i], style: tabStyle),
),
);
}),
),
w.SizedBox(height: 1),
// Chart content
_buildTab(theme, labelStyle),
],
),
),
),
);
}
w.Widget _buildTab(w.Theme theme, Style labelStyle) {
switch (_tabIndex) {
case 0:
return _buildSparklineTab(theme, labelStyle);
case 1:
return _buildLineTab(theme, labelStyle);
case 2:
return _buildBarTab(theme, labelStyle);
case 3:
return _buildHeatmapTab(theme, labelStyle);
case 4:
return _buildPieTab(theme, labelStyle);
case 5:
return _buildRibbonTab(theme, labelStyle);
default:
return w.Text('Unknown tab');
}
}
w.Widget _buildSparklineTab(w.Theme theme, Style labelStyle) {
return w.Column(
crossAxisAlignment: w.CrossAxisAlignment.start,
children: [
w.Text('Sparkline — compact single-row chart', style: labelStyle),
w.SizedBox(height: 1),
_HoverTracker(
builder: (context, hx, hy) => w.SparklineChart(
values: [10, 20, 15, 30, 25, 18, 35, 28, 40, 22, 33, 12, 27, 19],
height: 1,
style: UvStyle(fg: UvColor.rgb(80, 200, 120)),
legendEntries: [
ChartLegendEntry(
label: 'CPU',
style: UvStyle(fg: UvColor.rgb(80, 200, 120)),
),
],
legendPosition: w.ChartLegendPosition.topRight,
crosshairX: hx,
crosshairY: hy,
crosshairStyle: UvStyle(fg: UvColor.rgb(255, 255, 100)),
),
),
w.SizedBox(height: 1),
w.Text('Multi-row sparkline:', style: labelStyle),
_HoverTracker(
builder: (context, hx, hy) => w.SparklineChart(
values: [5, 15, 10, 25, 20, 35, 30, 40, 28, 33],
height: 5,
style: UvStyle(fg: UvColor.rgb(255, 180, 50)),
showGrid: true,
gridStyle: UvStyle(fg: UvColor.rgb(60, 60, 60)),
legendEntries: [
ChartLegendEntry(
label: 'Load',
style: UvStyle(fg: UvColor.rgb(255, 180, 50)),
),
],
legendPosition: w.ChartLegendPosition.topRight,
crosshairX: hx,
crosshairY: hy,
crosshairStyle: UvStyle(fg: UvColor.rgb(255, 255, 100)),
),
),
],
);
}
w.Widget _buildLineTab(w.Theme theme, Style labelStyle) {
return w.Column(
crossAxisAlignment: w.CrossAxisAlignment.start,
children: [
w.Text(
'Line Chart — press R to randomise data (rev #$_dataRevision)',
style: labelStyle,
),
w.SizedBox(height: 1),
_HoverTracker(
builder: (context, hx, hy) => w.ChartBuilder(
model: _lineModel,
builder: (context, model) => w.LineChart(
values: model.values,
height: 14,
showGrid: model.showGrid,
showMarkers: model.showMarkers,
gridRows: 3,
gridCols: 4,
lineStyle: UvStyle(fg: UvColor.rgb(80, 180, 255)),
gridStyle: UvStyle(fg: UvColor.rgb(50, 50, 60)),
xLabels: ['0', '5', '10', '15', '20'],
yLabels: ['0', '25', '50'],
legendEntries: [
ChartLegendEntry(
label: 'Latency',
style: UvStyle(fg: UvColor.rgb(80, 180, 255)),
),
],
legendPosition: w.ChartLegendPosition.topRight,
crosshairX: hx,
crosshairY: hy,
crosshairStyle: UvStyle(fg: UvColor.rgb(255, 255, 100)),
),
),
),
],
);
}
w.Widget _buildBarTab(w.Theme theme, Style labelStyle) {
return w.Column(
crossAxisAlignment: w.CrossAxisAlignment.start,
children: [
w.Text('Bar Chart (Histogram)', style: labelStyle),
w.SizedBox(height: 1),
_HoverTracker(
builder: (context, hx, hy) => w.BarChart(
values: [12, 28, 18, 35, 22, 40, 15, 30, 25, 33],
height: 12,
showAxis: true,
showGrid: true,
gridRows: 3,
barStyle: UvStyle(fg: UvColor.rgb(100, 200, 50)),
axisStyle: UvStyle(fg: UvColor.rgb(120, 120, 120)),
gridStyle: UvStyle(fg: UvColor.rgb(50, 50, 60)),
xLabels: ['Q1', 'Q2', 'Q3', 'Q4'],
legendEntries: [
ChartLegendEntry(
label: 'Revenue',
style: UvStyle(fg: UvColor.rgb(100, 200, 50)),
),
],
legendPosition: w.ChartLegendPosition.topRight,
crosshairX: hx,
crosshairY: hy,
crosshairStyle: UvStyle(fg: UvColor.rgb(255, 255, 100)),
),
),
],
);
}
w.Widget _buildHeatmapTab(w.Theme theme, Style labelStyle) {
// Generate a 10x10 gradient heatmap
final grid = List.generate(
10,
(row) => List.generate(10, (col) => (row + col) / 18.0),
);
return w.Column(
crossAxisAlignment: w.CrossAxisAlignment.start,
children: [
w.Text('Heatmap — thermal ramp', style: labelStyle),
w.SizedBox(height: 1),
_HoverTracker(
builder: (context, hx, hy) => w.HeatmapChart(
grid: grid,
height: 10,
ramp: ChartRamp.thermal(),
showGrid: true,
gridRows: 2,
gridCols: 2,
gridStyle: UvStyle(fg: UvColor.rgb(180, 180, 180)),
legendEntries: [
ChartLegendEntry(
label: 'Cool',
style: UvStyle(bg: UvColor.rgb(35, 65, 170)),
),
ChartLegendEntry(
label: 'Warm',
style: UvStyle(bg: UvColor.rgb(240, 145, 40)),
),
ChartLegendEntry(
label: 'Hot',
style: UvStyle(bg: UvColor.rgb(210, 55, 45)),
),
],
legendColumns: 3,
legendPosition: w.ChartLegendPosition.bottomLeft,
crosshairX: hx,
crosshairY: hy,
crosshairStyle: UvStyle(fg: UvColor.rgb(255, 255, 100)),
),
),
],
);
}
w.Widget _buildPieTab(w.Theme theme, Style labelStyle) {
return w.Column(
crossAxisAlignment: w.CrossAxisAlignment.start,
children: [
w.Text('Pie Chart', style: labelStyle),
w.SizedBox(height: 1),
w.Row(
children: [
w.Expanded(
child: w.Column(
children: [
w.Text('Standard', style: labelStyle),
_HoverTracker(
builder: (context, hx, hy) => w.PieChart(
values: [35, 25, 40],
height: 11,
sliceStyles: [
UvStyle(bg: UvColor.rgb(230, 57, 70)),
UvStyle(bg: UvColor.rgb(42, 157, 143)),
UvStyle(bg: UvColor.rgb(233, 196, 106)),
],
legendEntries: [
ChartLegendEntry(
label: 'Added',
style: UvStyle(bg: UvColor.rgb(230, 57, 70)),
),
ChartLegendEntry(
label: 'Removed',
style: UvStyle(bg: UvColor.rgb(42, 157, 143)),
),
ChartLegendEntry(
label: 'Changed',
style: UvStyle(bg: UvColor.rgb(233, 196, 106)),
),
],
legendPosition: w.ChartLegendPosition.bottomLeft,
crosshairX: hx,
crosshairY: hy,
crosshairStyle: UvStyle(fg: UvColor.rgb(255, 255, 100)),
),
),
],
),
),
w.SizedBox(width: 4),
w.Expanded(
child: w.Column(
children: [
w.Text('Donut', style: labelStyle),
_HoverTracker(
builder: (context, hx, hy) => w.PieChart(
values: [35, 25, 40],
height: 11,
donut: true,
sliceStyles: [
UvStyle(bg: UvColor.rgb(80, 180, 255)),
UvStyle(bg: UvColor.rgb(255, 120, 80)),
UvStyle(bg: UvColor.rgb(160, 120, 255)),
],
legendEntries: [
ChartLegendEntry(
label: 'Core',
style: UvStyle(bg: UvColor.rgb(80, 180, 255)),
),
ChartLegendEntry(
label: 'IO',
style: UvStyle(bg: UvColor.rgb(255, 120, 80)),
),
ChartLegendEntry(
label: 'UI',
style: UvStyle(bg: UvColor.rgb(160, 120, 255)),
),
],
legendPosition: w.ChartLegendPosition.bottomLeft,
crosshairX: hx,
crosshairY: hy,
crosshairStyle: UvStyle(fg: UvColor.rgb(255, 255, 100)),
),
),
],
),
),
],
),
],
);
}
w.Widget _buildRibbonTab(w.Theme theme, Style labelStyle) {
return w.Column(
crossAxisAlignment: w.CrossAxisAlignment.start,
children: [
w.Text('Ribbon Chart (Stacked Area)', style: labelStyle),
w.SizedBox(height: 1),
_HoverTracker(
builder: (context, hx, hy) => w.RibbonChart(
series: [
[10, 20, 30, 25, 35, 28, 40, 32],
[15, 10, 20, 30, 15, 25, 18, 22],
[8, 12, 15, 10, 20, 18, 12, 16],
],
height: 12,
normalizeTotals: true,
showGrid: true,
gridRows: 3,
gridStyle: UvStyle(fg: UvColor.rgb(50, 50, 60)),
seriesStyles: [
UvStyle(fg: UvColor.rgb(80, 180, 255)),
UvStyle(fg: UvColor.rgb(255, 120, 80)),
UvStyle(fg: UvColor.rgb(100, 220, 100)),
],
legendEntries: [
ChartLegendEntry(
label: 'Network',
style: UvStyle(fg: UvColor.rgb(80, 180, 255)),
),
ChartLegendEntry(
label: 'Compute',
style: UvStyle(fg: UvColor.rgb(255, 120, 80)),
),
ChartLegendEntry(
label: 'Storage',
style: UvStyle(fg: UvColor.rgb(100, 220, 100)),
),
],
legendColumns: 2,
legendPosition: w.ChartLegendPosition.topLeft,
crosshairX: hx,
crosshairY: hy,
crosshairStyle: UvStyle(fg: UvColor.rgb(255, 255, 100)),
),
),
],
);
}
tui.Cmd? handleUpdate(tui.Msg msg) {
if (msg is tui.KeyMsg) {
final key = msg.key;
if (key.char == 'q' || key.char == 'Q') {
return tui.Cmd.quit();
}
if (key.char == 'r' || key.char == 'R') {
_refreshLineData();
return null;
}
// Tab switching: number keys 1-6
if (key.char != null &&
key.char!.codeUnitAt(0) >= 49 &&
key.char!.codeUnitAt(0) <= 54) {
setState(() => _tabIndex = key.char!.codeUnitAt(0) - 49);
return null;
}
}
return null;
}
}
Run it
dart run pkgs/artisanal_widgets/example/charting/main.dart